
Table 2.
Inhibition of calcium influx through voltage-dependent L-type calcium channels in GH4C1 cells by DHPs: comparison to inhibition of SOC channels in HL-60 cells
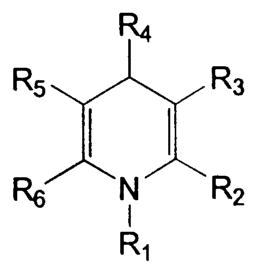
| ||||||||||
|---|---|---|---|---|---|---|---|---|---|---|
| Compound | R1 | R2 | R3 | R4 | R5 | R6 | L-type channel | SOC channel IC50c (μM) | Ratio SOC/L-type | |
| Imaxa (%) | IC50b (μM) | |||||||||
| 1 | H | Me | COOEt | Ph | COOMe | Me | 54 | 0.01 | 40 ± 8 | 4000 |
| 2 | H | Me | COOEt | CH=CH–Ph | COOMe | Me | 40 | 1 | 15 ± 6 | 15 |
| 6d | H | Me | COOEt | 3-NO2–Ph | COOMe | Me | 92 ± 4 | 0.003 ± 0.001 | 3.3 ± 1.2 | 1100 |
| 7 | H | Me | COOEt | 3-NO2–Ph | COOEt | Me | 77 | 0.003 | 5.0 ± 2.1 | 1600 |
| 8e | H | Me | COOMe | 2-NO2–Ph | COOMe | Me | 85 ± 3 | 0.01 ± 0.005 | 16 ± 2 | 1600 |
| 13 | H | Me | COOEt | 4-OMe–Ph | COOMe | Me | 60 | 3 | 36 ± 3 | 12 |
| 20 | H | Me | COOEt | 3-NO2–Ph | COOCH2Ph | Me | 55 | 0.001 | 1.8 ± 0.1 | 1800 |
| 21 | H | Me | COOCH2Ph | 3-NO2–Ph | COOCH2Ph | Me | 60 | 0.001 | 3.0 ± 1.5 | 3000 |
| 30 | Me | Me | COOMe | 3-NO2–Ph | COOMe | Me | 70 | 2 | 2.8 ± 0.3 | 1.4 |
| 32 | Me | Me | COOEt | 3-NO2–Ph | COOMe | Me | 86 ± 7 | 1.3 ± 0.3 | 2.6 ± 1.1 | 2.0 |
| 33 | Et | Me | COOEt | 3-NO2–Ph | COOMe | Me | 82 ± 4 | 2.3 ± 0.4 | 6 | 2.6 |
| 34 | Allyl | Me | COOEt | 3-NO2–Ph | COOMe | Me | 72 ± 5 | 3.8 ± 1.8 | 6.8 ± 1.8 | 1.8 |
| 35 | Propargyl | Me | COOEt | 3-NO2–Ph | COOMe | Me | 86 ± 7 | 2.1 ± 0.2 | 1.7 ± 1.3 | 0.8 |
a
Imax represents the maximum mean inhibition ± SEM (N = 3) by the DHP of the elevation of calcium levels elicited by depolarization of the cell membrane with 40 mM KCl. Single values are the average of two determinations.
b
The IC50 values represent the mean concentration ± SEM (N = 3) required for 50% of the maximum inhibition observed for each compound. Single values are the average of two determinations.
c
The IC50 values are from Table 1.
d
Nitrendipine.
e
Nifedipine.