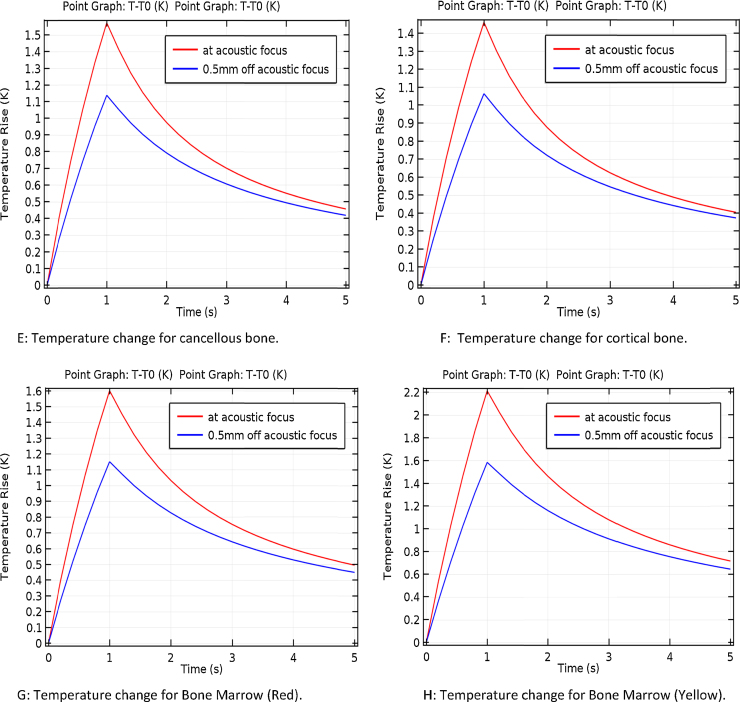
Fig. 2.
Isothermal contours and temperature distributions. (A) Isothermal contours for cancellous bone. (B) Isothermal contours for cortical bone. (C) Isothermal contours for bone marrow (red). (D) Isothermal contours for bone marrow (yellow). (E) Temperature change for cancellous bone. (F) Temperature change for cortical bone. (G) Temperature change for bone marrow (red). (H) Temperature change for bone marrow (yellow).


