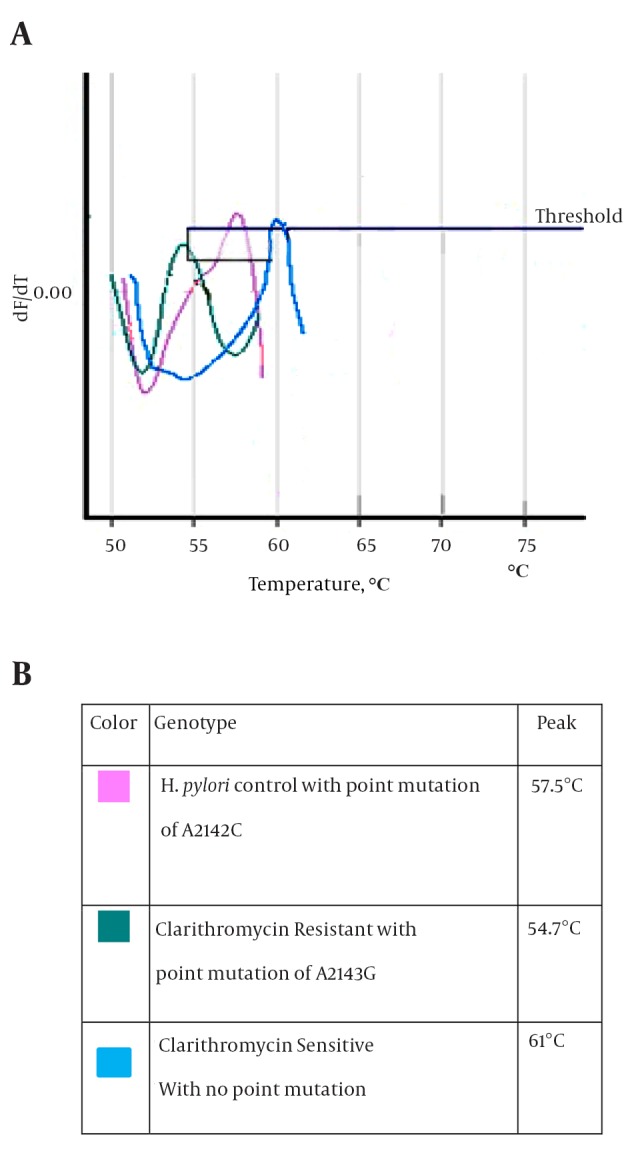
Figure 3. Details of Melting Curve.

A, Melting Curve shows the different melting temperatures of the 267-bp amplicon of the 23SrRNAof the control, sensitiveandresistant isolates of H. pylori in this study; B, details of the diagram.

A, Melting Curve shows the different melting temperatures of the 267-bp amplicon of the 23SrRNAof the control, sensitiveandresistant isolates of H. pylori in this study; B, details of the diagram.