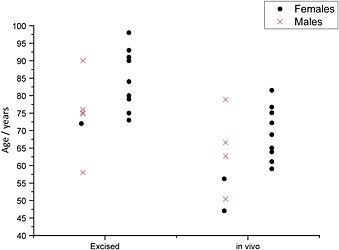
Figure 1.

The age and gender of the excised‐bone donors and the in vivo patients. In each group the ‘controls’ are on the left and the ‘diseased’ are on the right. The males are plotted as crosses and the females as circles (two circles overlap at 75 years in the ‘diseased’ ‐in vivo group).
