
Figure 6.
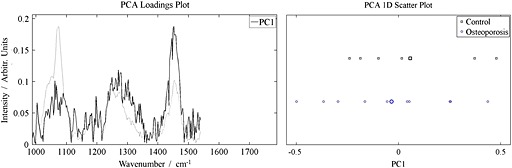
A. The reduced spectral region (from 987 cm−1 to 1540 cm−1) and the principal ‘collagen’ eigenvector for the in vivo measurements. The average spectrum is shown in the background. B. The ‘collagen score’ for each spectrum. The two classes are heavily overlapped.