
Figure 7.
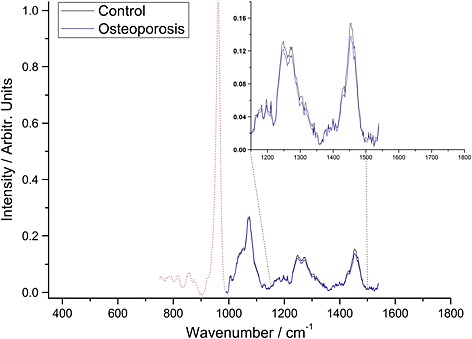
In vivo measurements: the average control and average osteoporosis spectra that have been reconstructed using the information from Fig. 6. The other bands (below 1000 cm−1) which were not used for the reconstruction are shown for illustration.