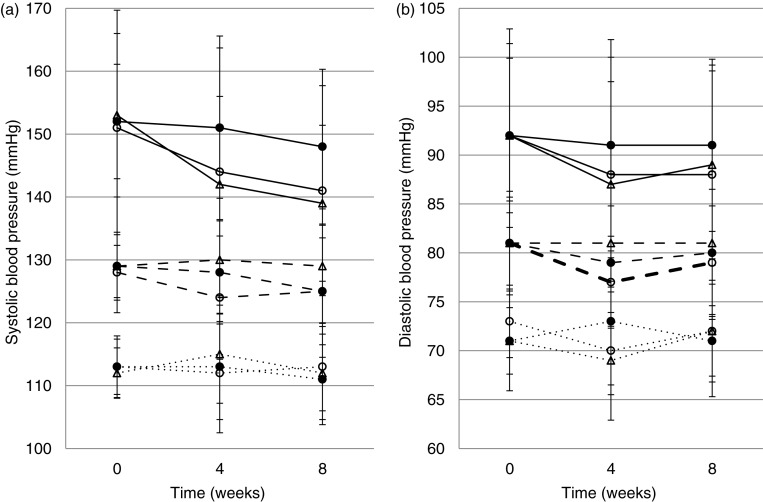
Fig. 3.
Systolic (a) and diastolic (b) blood pressure (mean (SD)) at baseline, midway, and end, in the three intervention groups. Solid lines: participants with hypertension at baseline; dashed lines: participants with normal-high BP at baseline, and dotted lines: participants with optimal BP at baseline. ○Gamalost®, ●Gouda-type cheese, ΔControl.

