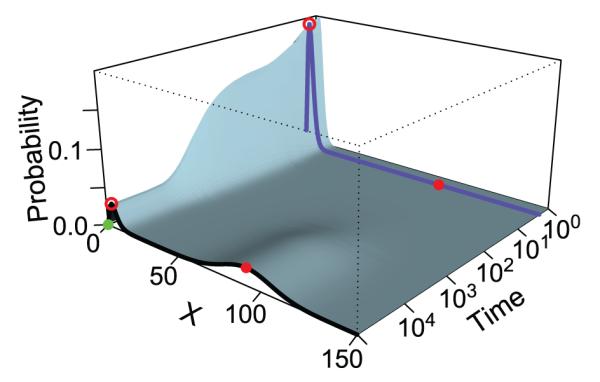
Figure 1.

The time-evolving probability and transition probability of rare events of the bistable Schlögl model. The blue and black curves show the landscape at t = 2 and at the steady state, respectively. The two high probability regions at the steady state (black curve) are located at x = 4 (red circle on black curve) and x = 92 (red dot on black curve), respectively. They are separated by a high barrier of low probability. The initial state x = 0 (green dot) is near the first peak, and the target state (red dot) is at the center of the second peak. The probability landscape at time t = 2 (blue curve) shows a much sharper peak centered at x = 3 (red circle on blue curve). The transition from x = 0 to x = 92 within t = 2 is a rare event and the transition paths have a steep barrier to cross. The probability of this rare event can be sampled effectively using the Absis method (adapted from reference[31]).
