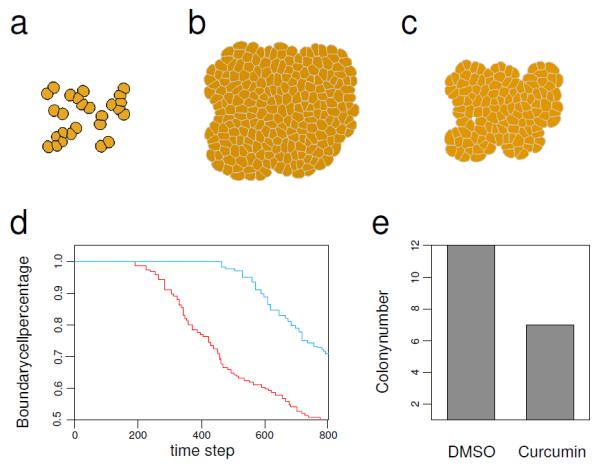
Figure 12.

Cancer cell growth under suppression induced by antitumor agents. (a). The initial state of cell growth. (b). Tumor tissue after 800 time steps using growth parameter modeling the effects of suppression from DMSO. (c). Tumor tissue after 800 time steps using growth parameter modeling the effects of suppression from curcumin. (d). The percentage of boundary cells, namely, the number of cell on boundary of the tissue over the total cell number, at each time step for DMSO treatment (red) and for curcumin treatment (blue). The higher boundary cells percentage corresponds to a more scattered cell population. (e). The colony number for DMSO and curcumin treatments. We count every 9 cells as one colony. The colony number ratio between the two treatments, 12 against 7, is consistent with the colony number ratio between the two treatments found in experiment studies[108] (see reference[104] for details).
