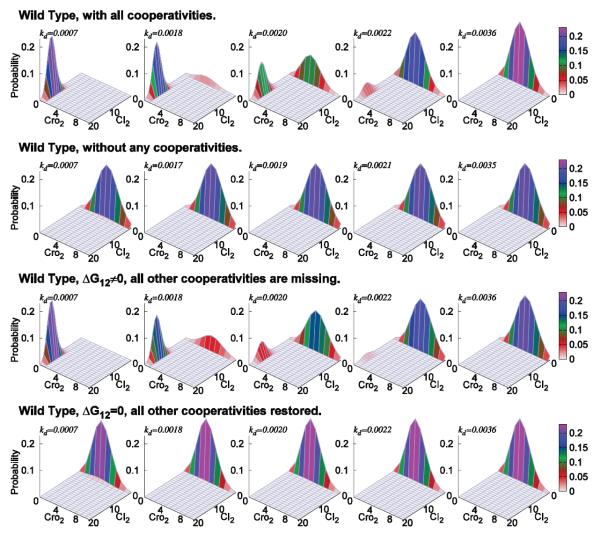
Figure 4.
The probability landscape of the epigenetic circuits of lysogeny maintenance in phage lambda. (Row 1) For wild type phage lambda, at the CI degradation rate of kd = 7.0 × 10⁻⁴/s, probability landscape centers at locations with high copy numbers of CI2 and close to 0 copy of Cro2. This corresponds to the lysogenic phase of phage lambda. When kd increases from kd = 1.8 × 10⁻³/s to 2.2 × 10⁻³/s, the peak located at lysogenic phase gradually diminishes, whereas the peak located at lytic phase gradually increases. At about kd = 2.0×10⁻³/s, phage lambda has about equal probability to be in either lysogenic or lytic phase. When CI is degraded at a faster rate of kd = 3.6 × 10⁻³/s, the probability landscape centers at locations where there are higher copy numbers of Cro dimer and close to 0 copy of CI. This corresponds to the lytic phase of phage lambda. (Row 2) When all cooperativities are removed from the model, lysogeny cannot be achieved. (Row 3) When only the cooperativity of ΔG12 is restored, wild-type behavior is largely restored. (Row 4) When all other cooperativities except ΔG12 are restored, lysogeny still cannot be achieved (Modified from reference[23]).

