Figure 6.

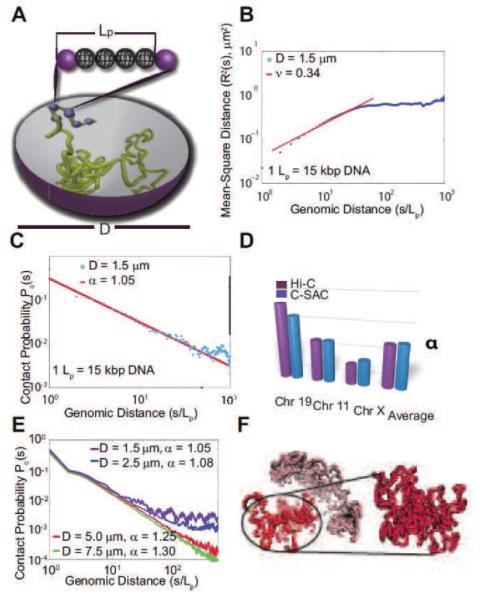
The physical model of C-SAC chains and its scaling properties. (A) Schematic representation of the C-SAC model. A chromatin fiber is represented by a self-avoiding polymer chain with a persistence length Lp. Polymers are grown as chains inside a spherical confined space of a diameter D. (B) The scaling of R2(s) from 10,000 chains of length 1,000Lp in log10 scale. (C) The scaling of contact probability Pc(s). (D) Comparison of exponent α of Pc(s) between C-SAC and Hi-C data.[13] Values of α for different chromosomes[13,53] were compared to those calculated separately for different clusters of C-SAC chains. (E) Pc(s) vs. chain length s for different confinement sizes D. (F) A random C-SAC chromatin chain with independent substructures. A singular domain-like conformation is shown in detail (adapted from reference[54]).
