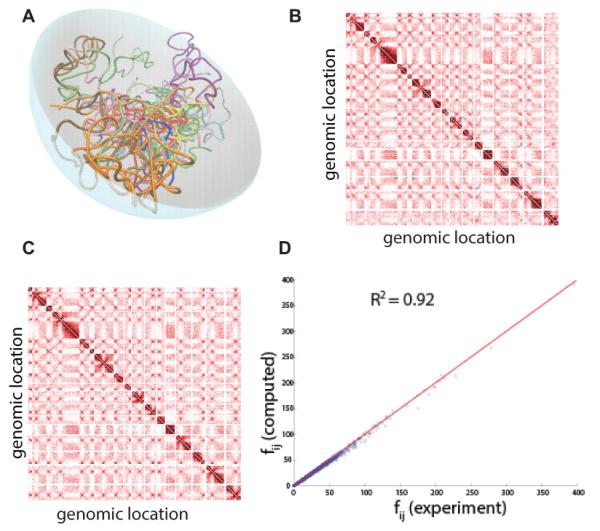
Figure 7.

Multi-chromosome model of budding yeast. (A) Schematic representation of yeast genome in the confined nuclear space. Different chromosomes are represented in different colors. (B) Heatmap of interactions that are taken from biochemical experiments.[14] Each block represents a chromosome and darker color indicates higher frequency interaction. (C) Heatmap of interactions that are averaged from predicted model genomes built without using any biochemical data. The heatmap generated using predicted models is very similar to the measured heatmap in (C). (D). Experimentally measured interaction frequencies correlate well with predicted interaction frequencies from our model (see reference[61] for more details.
