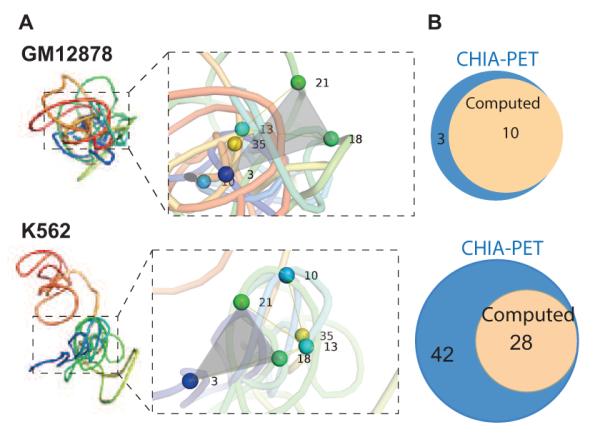
Figure 8.

Structural models of the α-globin gene domain. (A) Representative three-dimensional chromatin chains of the α-globin gene domain in the GM12878 and the K562 cell lines. The α-globin gene domain has only one domain and is more compact in the GM12878 cell. In the K562 cell, the α-globin gene domain has two distinct domains that form a more extended structure. Close-up views of selected sites for comparison between cell lines are also shown, with specific nodes noted. (B) Comparison between the number of CTCF- (top) and RNAPol2-mediated (bottom) interactions based on the predicted model (beige) and based on measurements from an independent experimental study using the technique of CHIA-PET (blue, reference[76]).
