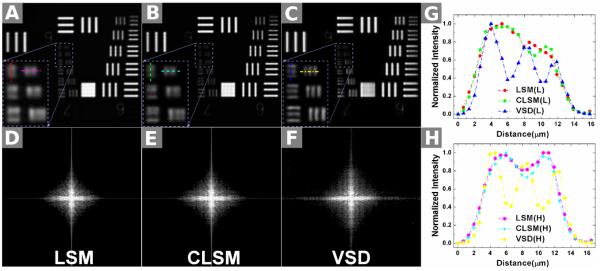
FIG. 15.
Comparison of 3 different imaging results using the USAF standard-resolution target: by conventional line-scanning microscopy (LSM) (A); by confocal LSM (CLSM) (B); and by reconstruction using virtually structured detection (VSD) (C). The magnified views of the smallest bars are indicated by the rectangles in (A–C). (D–F) The corresponding results of (A–C), respectively, in the Fourier domain. (G): Normalized intensity profiles along the longitudinal direction in (A–C). (H) Normalized intensity profiles along the horizontal direction in (A–C). (From Ref. 88. Reprinted with permission from the Optical Society (OSA).)

