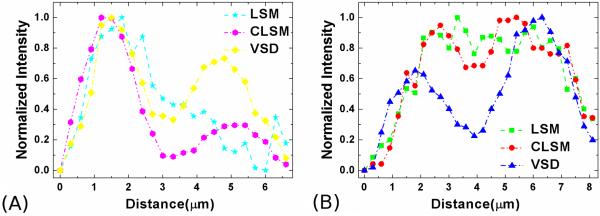
FIG. 17.
(A) The normalized intensity profiles of the selected adjacent photoreceptors (along upper lines) in Fig. 16A, B, and C are plotted. (B) The normalized intensity profiles of the selected adjacent photoreceptors (along lower lines) in Fig. 16A, B, and C are plotted. CLSM, confocal line-scanning microscopy; LSM, line-scanning microscopy; VSD, virtually structured detection. (From Ref. 88. Reprinted with permission from the Optical Society (OSA).)

