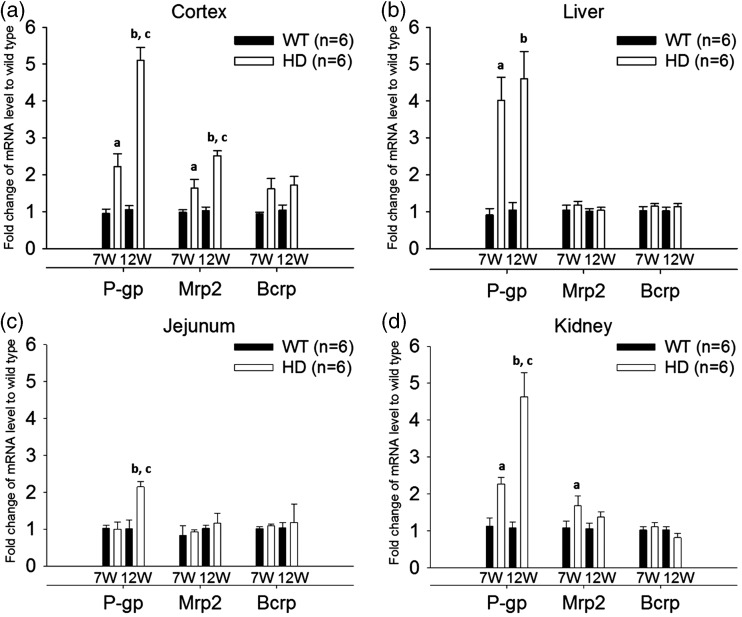
Figure 2.
mRNA levels of P-gp, Mrp2, and Bcrp in the cerebral cortex (a), liver (b), jejunum (c), and kidney (d) of R6/2 HD mice at 7 weeks and 12 weeks of age (white bars), compared to WT controls (black bars). For tissues from mice of the same age, the relative expression was calculated by 2−ΔΔCt. The ΔΔCt value was obtained by subtracting the mean ΔCt value of WT controls from the individual ΔCt value of the same transporter. The data are given as the mean ± SEM of six animals. Fold changes greater than 1 indicate upregulation and fold changes less than 1 indicate down-regulation. aP < 0.05 compared to WT mice at 7 weeks of age; bP < 0.05 compared to WT mice at 12 weeks of age; cP < 0.05 compared to HD mice at 7 weeks of age.

