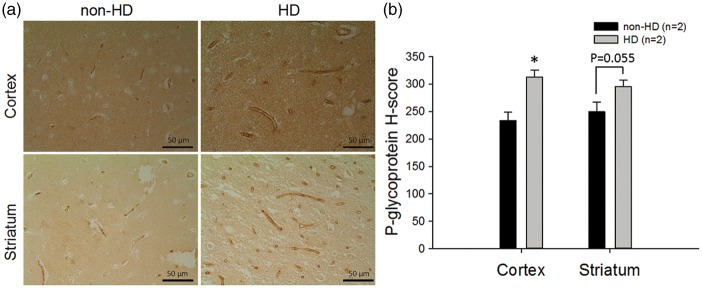
Figure 4.
Immunohistochemical analysis of P-gp protein in the cortex (upper panel) and striatum (lower panel) of human brains in non-HD and HD subjects (a) and the quantification results (b). Scale bars indicate 50 µm. Representative images are shown. To quantify P-gp expression, a total of three fields were randomly chosen from each subject. Six assigned H-score values from HD patients (n = 2) and six from non-HD controls (n = 2) are compared. The data are given as the mean ± SEM, and the asterisk indicates P < 0.05 compared to the results of non-HD human brains.

