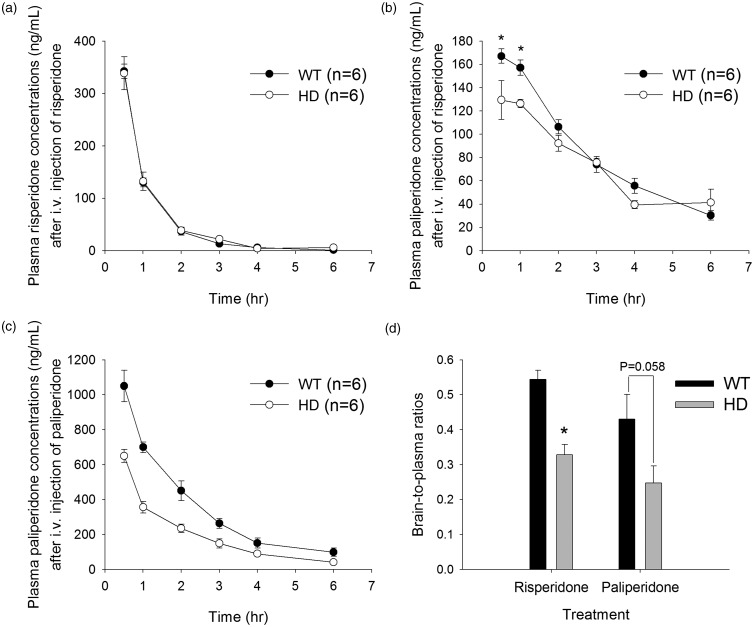
Figure 7.
Plasma concentrations of risperidone (a) and its metabolite (paliperidone) (b) in WT mice (black circles) and R6/2 HD mice (white circles) after an intravenous injection of 3 mg/kg risperidone. The asterisk indicates P < 0.05 compared to HD mice. (c) Plasma concentrations of paliperidone after an intravenous injection of 3 mg/kg paliperidone. (d) Brain-to-plasma ratios of risperidone or paliperidone after an intravenous injection of 3 mg/kg risperidone or paliperidone, respectively. The data are presented as the mean ± SEM of five mice.

