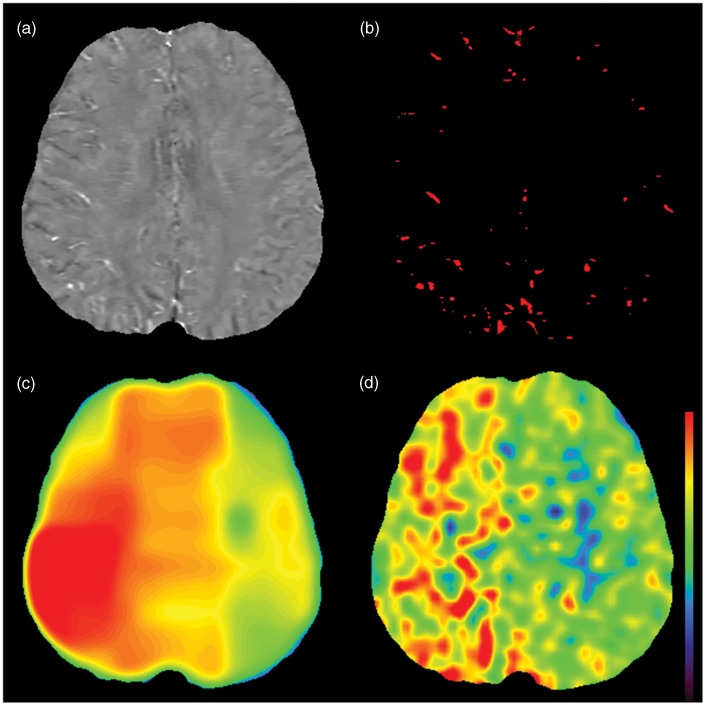
Figure 1.
Creation of oxygen extraction fraction (OEF) map. Quantitative susceptibility map (QSM) in patient of right internal carotid artery occlusion (73-year-old male) is shown (a). Bright veins in the right hemisphere are noted, which indicates increased amount of deoxygenated hemoglobin. Venous mask image (b) is obtained by using local threshold method. Oxygen extraction fraction (OEF) map (c) is created from susceptibility value of these veins. Increased OEF is observed in the right hemisphere, which corresponds well to OEF map of PET (d). The same color scale is used both for QSM-OEF and PET-OEF.

