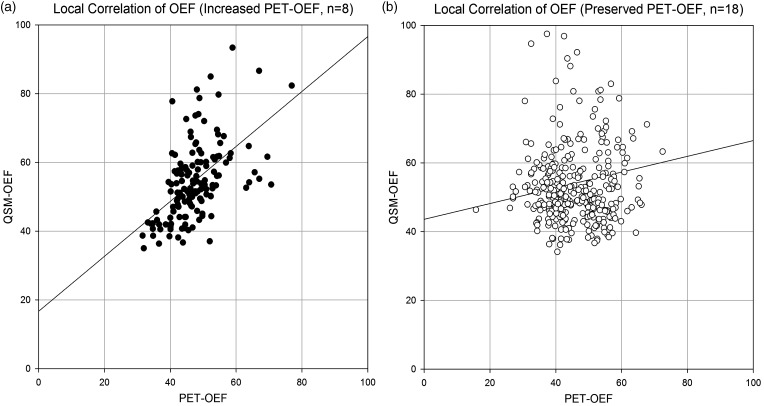
Figure 5.
Local correlation between PET-OEF and QSM-OEF. Scatter plot of PET-OEF and QSM-OEF are shown for all ROI data (18 ROIs for each patient), with increased PET-OEF patients (n = 8, a), and preserved PET-OEF patients (n = 18, b). In increased PET-OEF group, significant and moderate correlation is observed (p < 0.001, r = 0.52), and the linear regression line is y = 0.80 x + 16.69. In contrast, the correlation is also significant but weak (p = 0.006, r = 0.15) in preserved PET-OEF group, with the linear regression line of y = 0.23 x + 43.58) .

