Figure 1.
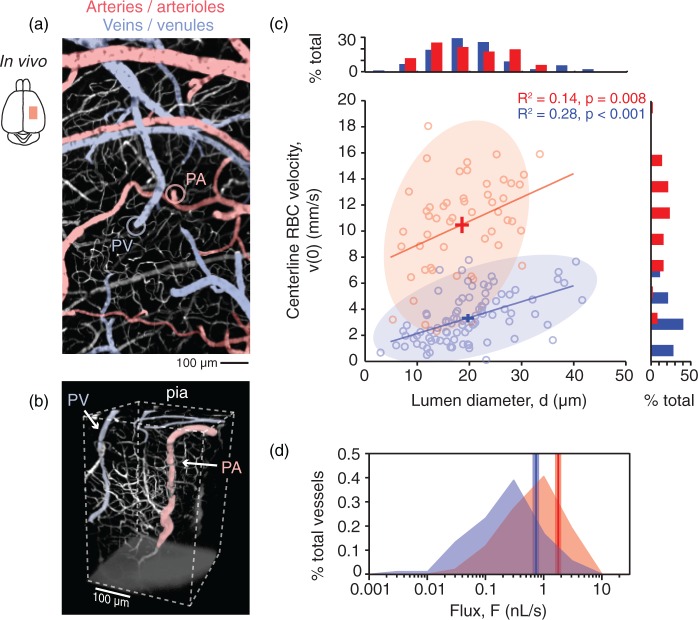
In vivo vasodynamics of individual penetrating vessels in mouse cortex. (a) In vivo two-photon image of cortical pial vasculature. Arterioles are pseudocolored in red and venules in blue. The image is composed of a montage of maximally projected stacks spanning a depth of 75 µm from the pial surface. Subsurface capillaries within this imaging depth are shown in white, as are dural vessels. The point of entry for a single penetrating arteriole (PA) into the cortical parenchyma is marked with a red circle and the exit of a single penetrating venule (PV) from the parenchyma is marked with a blue circle. (b) 3-D rendering of an in vivo image stack providing a side view of a PA and PV. This stack was taken in vivo following removal of the overlying skull to show penetrating vessels at depth. (c) Scatter plot and histograms of centerline RBC velocity, v(0), plotted as a function of lumen diameter, d, for individual penetrating vessels. The crossbars show mean ± SEM for all data points in each vessel group. (d) Histogram showing the distribution of RBC volume flux, F, for PAs and PVs. A vertical line marks the average flux for each vessel type and the range for SEM is shaded.

