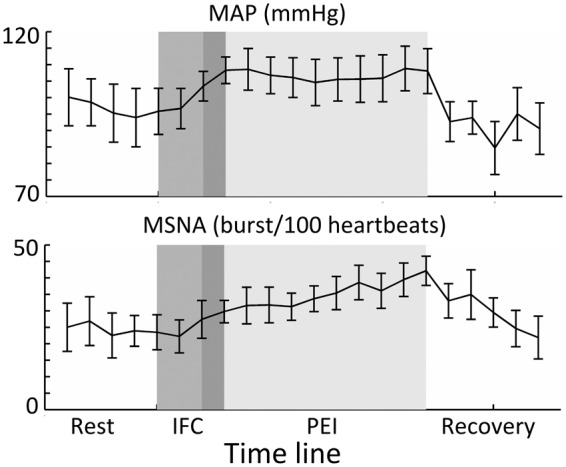
Figure 1.

Group average data (N = 7) resulting from the MSNA sessions. In each of the sessions, there was a resting recording (of at least 3 min), followed by a 3-min period of IFC at 40% (middle grey) and a 10-min period of PEI (lightest grey). Note that there was 1 min of overlap (dark grey) between the IFC and occlusion with the brachial blood pressure cuff (PEI). In the top graph, it can be seen that mean arterial pressure (MAP) increases during IFC and remains elevated throughout PEI. In the bottom graph, it can be seen that MSNA shows a steady increase from baseline to a maximum at the end of PEI. Error bars indicate SEM.
