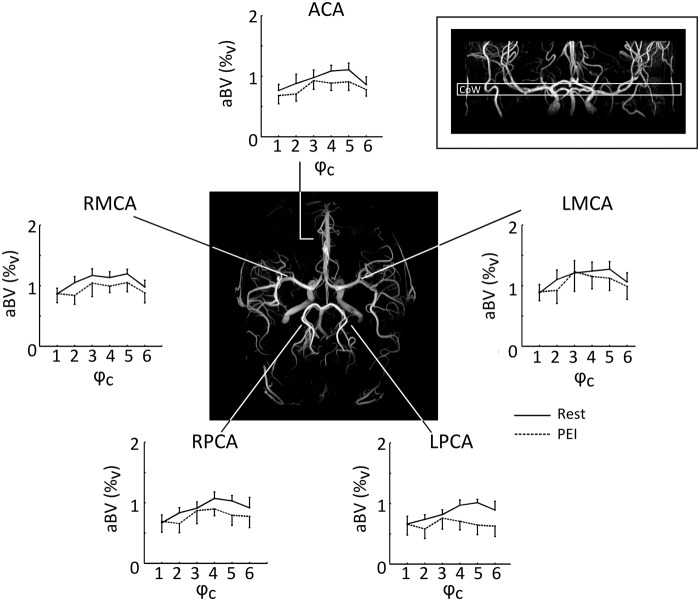
Figure 2.
Fitted aBV (%v) per cardiac phase (ϕc). Group average values (N = 8) are shown for the arteries in a single slice containing the Circle of Willis, indicated by the inlay in the upper right corner. The angiogram in the centre illustrates the locations of the cerebral arteries. During PEI, aBV was particularly lower during systole (ϕc = 5), while there was no decrease in aBV during diastole (ϕc = 1), indicating that PEI is related to a decrease in AC by affecting the aBV at higher BP (note that BPSys > BPDia). Error bars indicate SEM. aBV: arterial blood volume; BP: blood pressure; PEI: post exercise ischemia.

