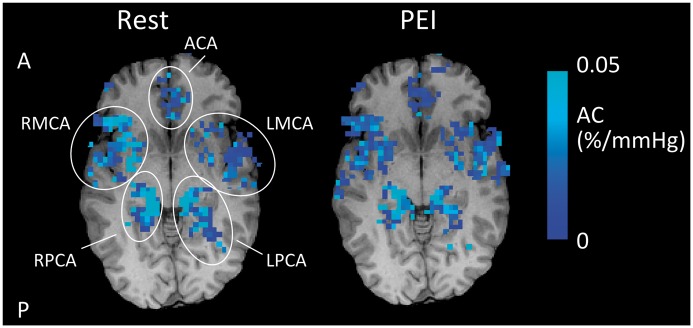
Figure 4.
Example of T1-weighted structural image with AC maps overlaid in Rest and during PEI for a single subject. Note that the AC maps are masked with the ROIs as defined by the average aBV images (see Methods section for details of ROI formation). In addition, the maps are thresholded to show voxels with positive AC. It can be seen that AC decreases during PEI. A: anterior; P: posterior.

