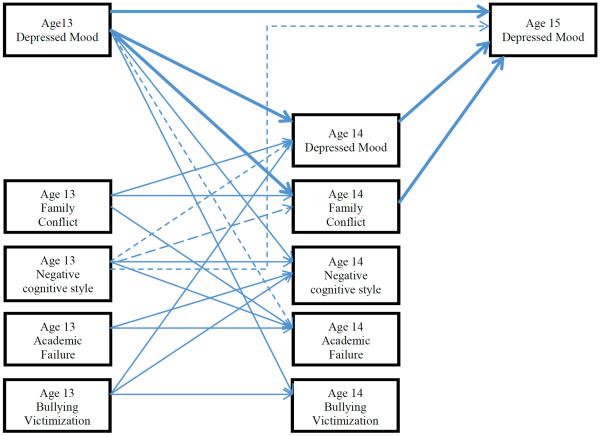
Figure 1.
Final path model. All continuous lines are statistically significant (.05 > p > .001). Bold lines indicate paths of key interest in this study. This model was run on VIC and WA separately. Small dash lines indicate paths that were significant for VIC but not significant for WA. Large dash lines indicate paths that were significant for WA but not significant for VIC. Where lines are absent between adjacent constructs, paths are nonsignificant.

