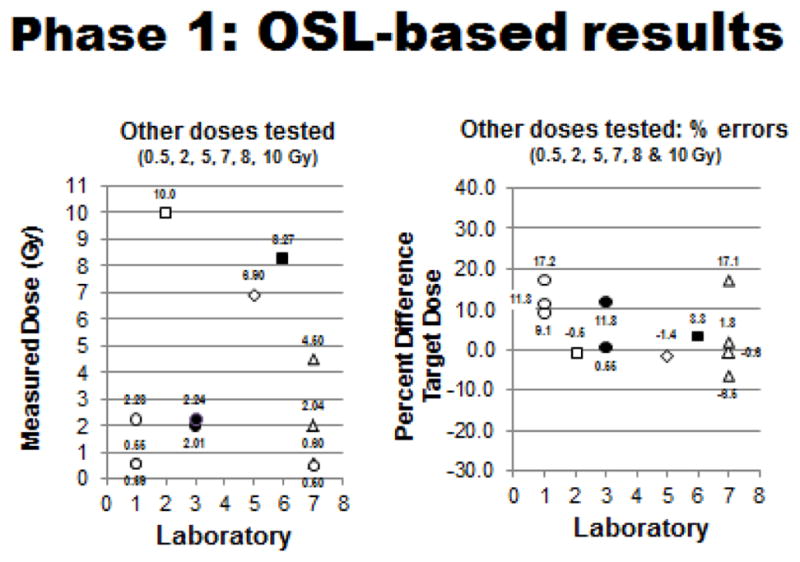
Figure 6.

Phase 1 OSL-based testing: Measured doses (left panel) and dosing errors (right panel) relative to all other target doses tested (0.5, 2, 5, 7, 8, & 10 Gy) for each participating laboratory. (Plotted doses are averages of measured doses with standard deviations generally ≤ 0.05, except for SDs of Lab #2 at 10 Gy of 0.20, Lab #5 at 7 Gy of 0.15, and Lab #6 at 8 Gy of 0.09: plotted % errors are average values with standard deviations generally ≤ 5.0, except for SDs of Lab #1 at 0.5 Gy of 9.1/17.2 and at 2.0 Gy of 11.3).
