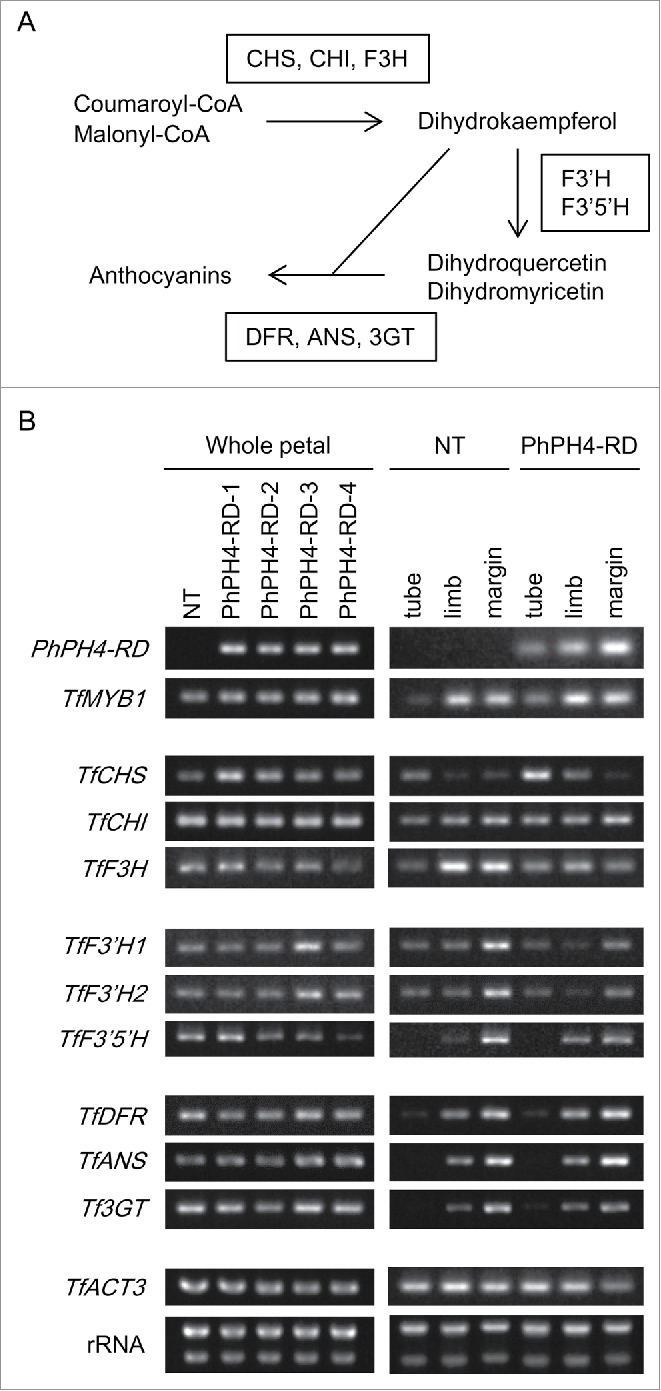
Figure 5.

Expression analysis of genes involved in anthocyanin synthesis. (A) Simplified illustration of the pathway of anthocyanin synthesis. (B) Semi-quantitative RT-PCR analysis. RNA samples were examined from whole petals (left) and from parts of petals (tube, limb, petal margin: right). rRNA, rRNA bands observed after electrophoresis of extracted RNA.
