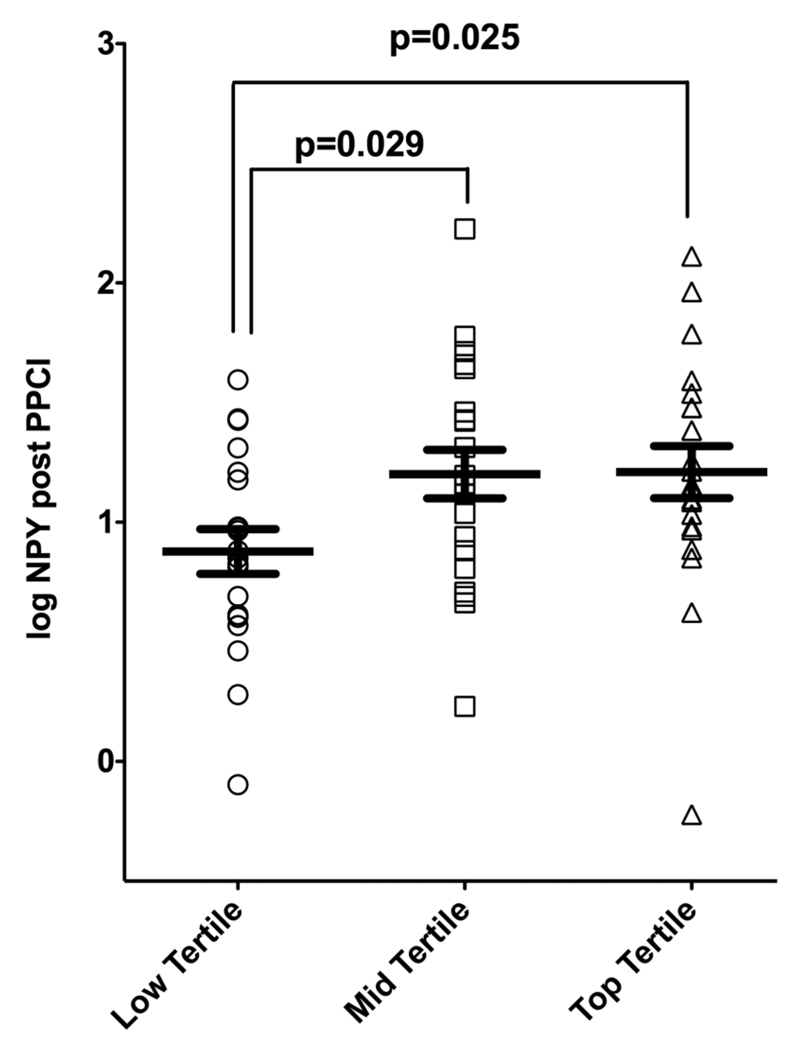
Figure 4.
Log plasma neuropeptide Y (NPY) levels according to tertiles of myocardial infarction size. Infarct size was assessed using log area under the curve (AUC) troponin (AUC from following measurements: pre-primary percutaneous intervention (PPCI), post-PPCI, 6 h, 24 h and 48 h). Log NPY values were compared using ANOVA (p=0.04) and the differences between the groups were evaluated using Bonferroni post hoc analysis.

