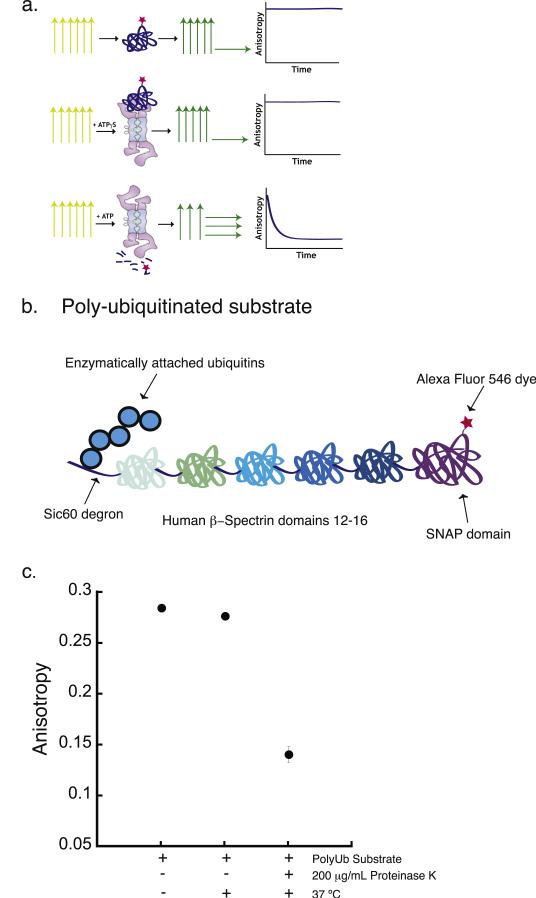
Fig. 1.
Proteasomal degradation assay based on fluorescence anisotropy measurement. (a) Cartoon of the experimental design of the proteasomal degradation assay based on the measurement of bulk steady-state fluorescence anisotropy. The three rows represent three different assay conditions. The top row shows the dye-labeled substrate alone, the middle row shows dye-labeled substrate in the presence of protea-some and the nonhydrolyzed ATP analogue ATPγS, and the bottom row shows dye-labeled substrate in the presence of proteasome and ATP. Under each of these conditions, the sample is excited with polarized light, represented by the yellow vertical arrows. The fluorescence emission from the sample and its polarization are represented by the green and yellow horizontal and vertical arrows. The graphical representations in the rightmost column indicate the expected experimental results when the anisotropy of the fluorescence signal emitted from the substrate is monitored over the time course of the degradation reaction. (b) Schematic representation of a polyubiquitinated substrate used for the degradation assay. The substrate is composed of a 60-amino acid unstructured region derived from yeast Sic1 at the N terminus (Sic60), followed by five domains from the human β-spectrin protein and finally a SNAP-tag domain at the C terminus. The Sic60 sequence acts as the degron and provides the polyubiquitination signal as well as the initiation region for proteasomal degradation. The SNAP-tag domain allows site-specific labeling of the substrate with a fluorescent dye. (c) Fluorescence anisotropy of the polyubiquitinated substrate before and after 2 h incubation at 37 °C in the absence or presence of 200 μg/mL proteinase K. Error bars show the standard error of the mean anisotropy obtained in four separate experiments.

