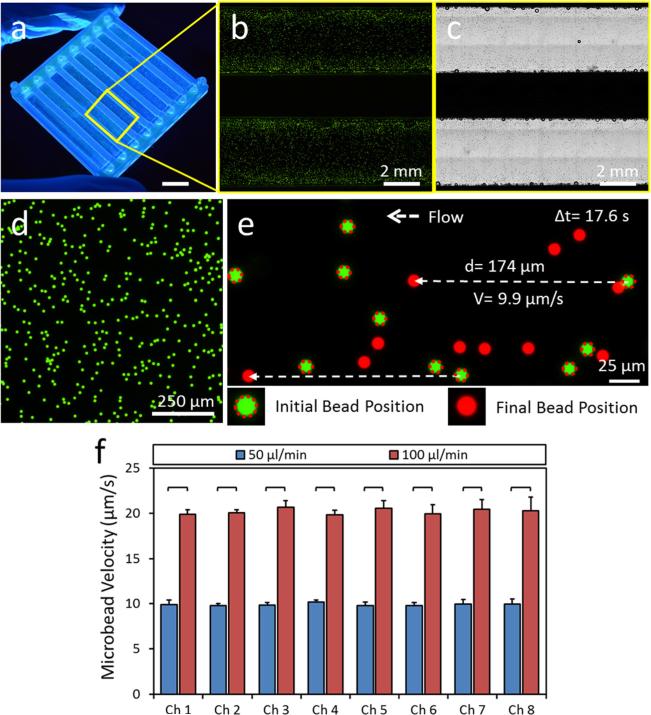
Fig. 7.
Homogenous flow distribution in microchannels of the 3D printed microfluidic device. (a) 3D printed microfluidic device prototype. Scale bar represents 10 mm length. (b) Fluorescent and (c) phase contrast images of microfluidic channels injected with fluorescent microbeads delineating microchannels. (d)–(f) Flow velocity in microchannels are determined by seeding (d) fluorescent microbeads of 10 μm diameter. Sequential images of flowing microbeads were recorded using an inverted fluorescent microscope and a charge coupled device (CCD) camera. (e) Bead velocities are calculated by dividing the total displacement of an individual bead to the elapsed time. (f) Microbead velocities are determined for each microchannels at 50 μl/min and 100 μl/min flow rates supplied to the device. There was no statistically significant difference between microbead velocities in different microchannels at the same flow rates. Microbead velocities were significantly higher in all microchannels at 100 μl/min flow rate compared to 50 μl/min flow rate. The horizontal lines between individual groups represent statistically significant difference based on one way ANOVA test with Tukey's posthoc test for multiple comparisons (n = 8, p < 0.05). Error bars represent the standard deviation of the mean.

