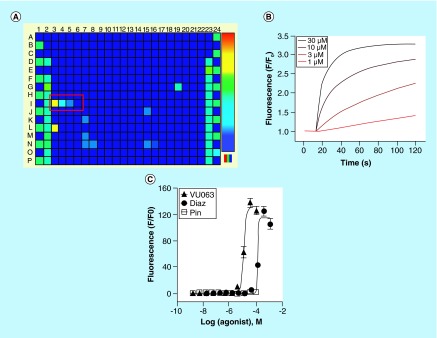
Figure 3. . Discovery and characterization of the KATP channel activator VU063.
(A) Fluorescence heat map of a Tl+ flux assay performed on HEK-293 cells heterologously expressing Kir6.2/SUR1 (see the ‘A flexible HTS platform for KATP channels’ section for details). Fluorescence emission data have been pseudocolored to indicate high Tl+ flux (warm colors – e.g., red, yellow) or low Tl+ flux (cool colors – e.g., blue, cyan). Wells I3-I6 (red box) received different concentrations of VU063, leading to dose-dependent Kir6.2/SUR1 opening and Tl+ flux. (B) Time versus fluorescence emission data recorded from four wells of a 384-well plate that received the indicated doses of VU063. The wells were prodosed with VU063 for 20 min before adding extracellular Tl+ at the ˜15-s time point. (C) Concentration–response curves for VU063, diazoxide and pinacidil from Tl+ flux assays performed on HEK-293-Kir6.2/SUR1 cells.
Reproduced with permission from [26].

