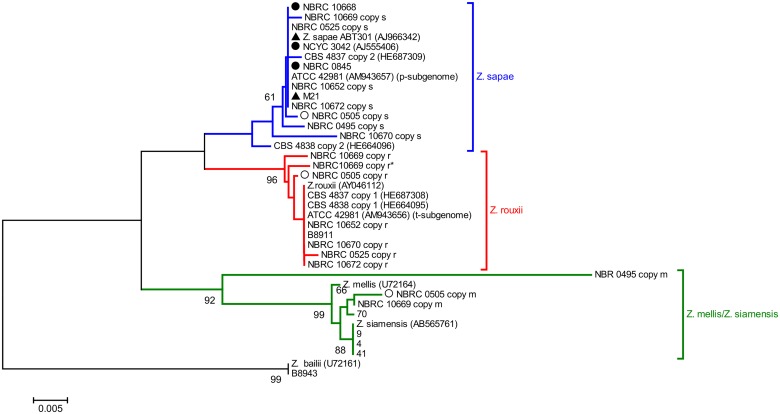
Fig 4. Phylogenetic relationships within the Z. rouxii complex based on 26S rDNA D1/D2 sequences.
This phylogeny was inferred using the Neighbor-Joining method using D1/D2 sequence of Z. bailii CBS 680T (GenBank accession number U72161) as outgroup. The percentages of replicate trees in which the associated taxa clustered together in the bootstrap test (10,000 replicates) are shown next to the branches (only values higher than 60% are reported). The tree is drawn to scale, with branch lengths in the same units as those of the evolutionary distances used to infer the phylogenetic tree. The evolutionary distances were computed using the Tajima-Nei method [48]. All positions containing gaps and missing data were eliminated. Z. rouxii, Z. sapae, and Z. mellis clades are colored in red, blue, and green, respectively. Black triangles represent strains with homogeneous 26S rDNA D1/D2 domains and heterogeneous ITS regions. Black circles indicate strains without rDNA heterogeneity. White triangles indicate strains with heterogeneous 26S rDNA D1/D2 domains and homogeneous ITS rDNA regions.

