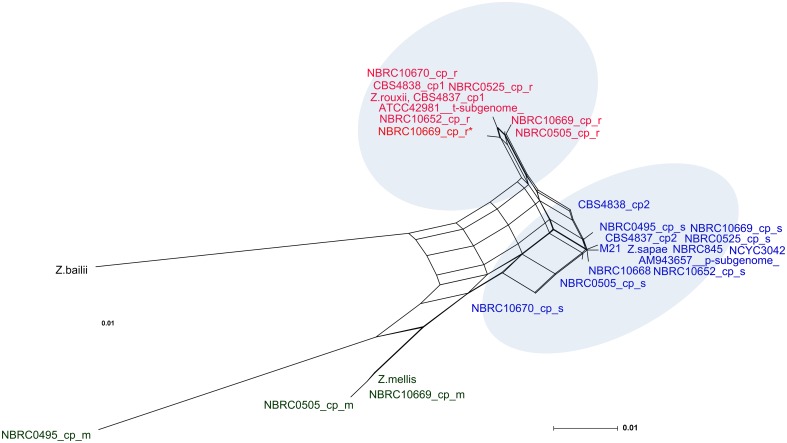
Fig 5. Neighbor-net network of D1/D2 sequences.
A dataset of 30 intra-genomic and inter-strain variants is considered. The scale bar represents the split support for the edges. For display purposes, bootstrap scores are not shown. Strains belonging to Z. sapae and Z. rouxii clusters are denoted by red and blue labels, respectively.

