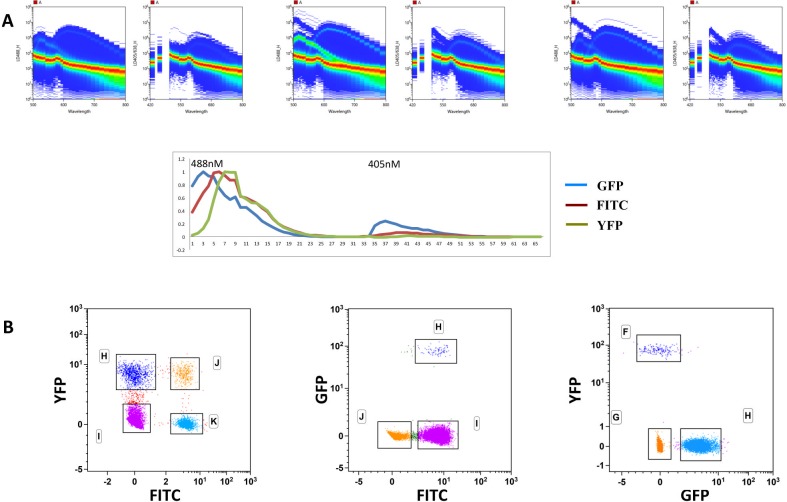
Fig 2. Spectral cytometry allows separating FTIC, from GFP and YFP.
Splenic cells from wild type C57BL/6 mice, from a RoRγt-Cre:Rosa26FL-STOP-YFP and from a ubiquitin-GFP CD8-TcR transgenic mouse were mixed two-by-two in similar proportions, stained with anti-CD8 FITC antibody and analyzed in spectral FCM. A. Plots showing the spectra on the two excitation lasers (left plot 488nm and right plot 405nm) of FITC with YFP and PI (left panels), FITC with GFP and PI (middle panels) and GFP with YFP and PI. The lower diagram shows the reference florochrome spectra shape calculated on single stained samples with GFP, FITC and YFP. B. Plots corresponding to the three independent unmixings of the two-by-two cell combinations. In all samples PI was added to exclude dead cells. The analysis was done in the Kaluza 1.5 software and the scales were readjusted in the FITC:YFP lower left plot.

