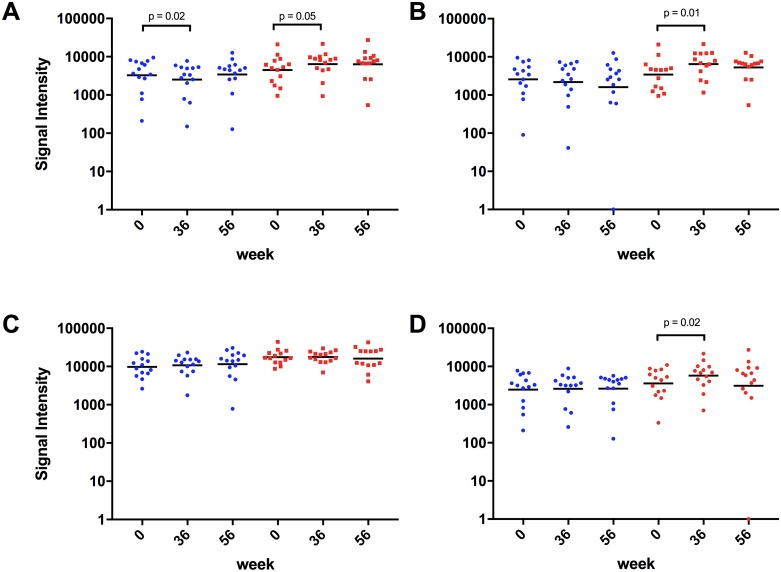
Fig 2. Evaluation of antibody binding signal intensities.
Microarray signal intensities were analyzed for differences within the non-vaccine arm (blue scatter plots) as well as the vaccine arm (red scatter plots). Signals deriving from the cross clade response (A), the clade A gp140 response (B), the clade B gp140 response (C), and clade C gp140 response (D) were evaluated and analyzed for significant differences using a RM ANOVA and Dunnett’s multiple comparisons test (GraphPad Prism 7.0). The cross clade (A) signal intensities at week 36 (p = 0.05) in the vaccine arm and the clade A (B) and clade C (D) signal intensities at week 36 (p = 0.01) and p = 0.02, respectively) in the vaccine arm were significantly higher compared to baseline. No significant differences were found in the clade B (C) signal intensities in the vaccine arm.

