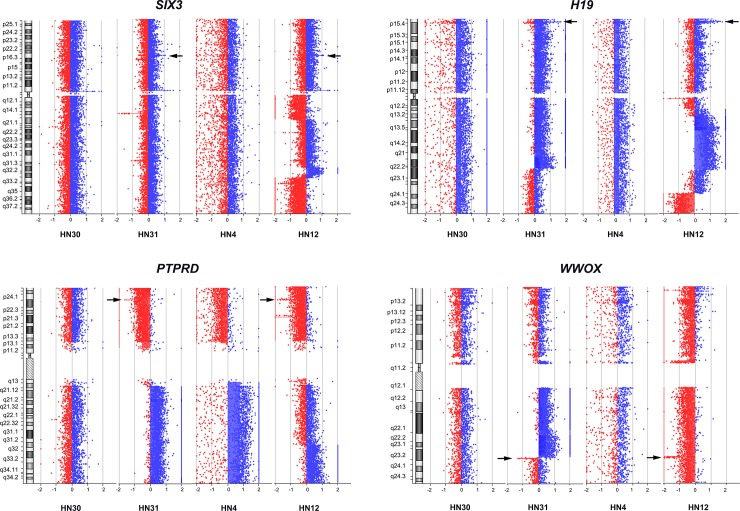
Fig 4. Amplification of SIX3 and H19, and deletion of PTPRD and WWOX in four head and neck squamous cell carcinoma cell lines.
The X-axis represents the normalize log2 ratio fluorescence intensity thresholds -0.9 (loss) and 0.53 (gain), while the Y-axis represents the ideogram of human chromosome. Arrows indicate amplification of SIX3 (2p21) and H19 (11p15.5), and deletion of PTPRD (9p23) and WWOX (16q23.1) in HN31 and HN12 cell lines.

