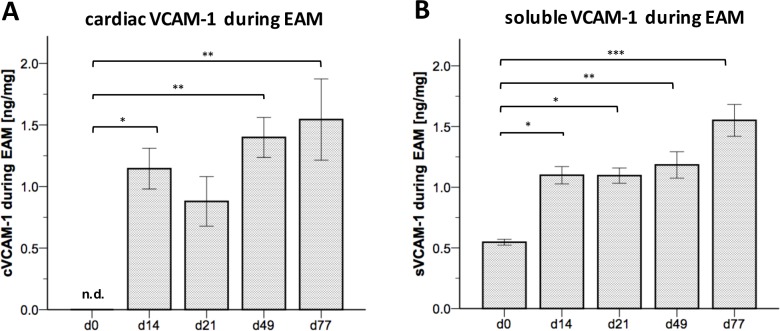
Fig 1. Cardiac and soluble VCAM-1 levels were elevated during EAM.
(A) ELISA of EAM hearts revealed a distinct upregulation of cVCAM-1 at different time points, especially at the beginning of leukocyte infiltration (~ day 14) and at chronic stages of disease. (B) Accordingly, quantification of plasma levels of VCAM-1 showed a significant augmentation at all time points. n = 3–9 for cVCAM-1 (n = 3 for day 0, n = 9 for day 14, n = 7 for day 21, n = 6 for day 49 and day 77, each value representing a pooled analysis of 2 hearts), n = 6–12 for sVCAM-1 (n = 6 for day 0, n = 11 for day 14, n = 7 for day 21, n = 12 for day 49 and day 77). * = p < 0.05; ** = p < 0.01, *** = p < 0.001, n.d. = not detectable.

