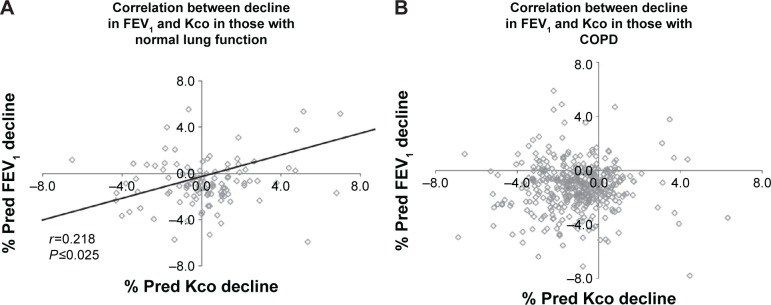
Figure 3.
The relationship between the decline in FEV1 and Kco.
Notes: The figure substratifies correlations between FEV1 and Kco values in individual patients without (A) and with (B) established COPD. The correlation coefficient (r) is shown for both the groups with its significance (P). In both the graphs, the horizontal axis goes through the point of no decline in FEV1, such that those points lying below the line have worsening FEV1, while those above it have shown an improvement. Similarly the vertical axis passes through the point of no decline in Kco, such that those points lying to the left are deteriorating, while those to the right are not. The four quadrants therefore represent decline in both FEV1 and Kco (bottom left), decline in Kco alone (upper left), decline in FEV1 alone (bottom right), and decline in neither measure (upper right). Kco is gas transfer corrected for alveolar ventilation.
Abbreviations: % pred, % predicted; COPD, chronic obstructive pulmonary disease; FEV1, forced expired volume in 1 second.

