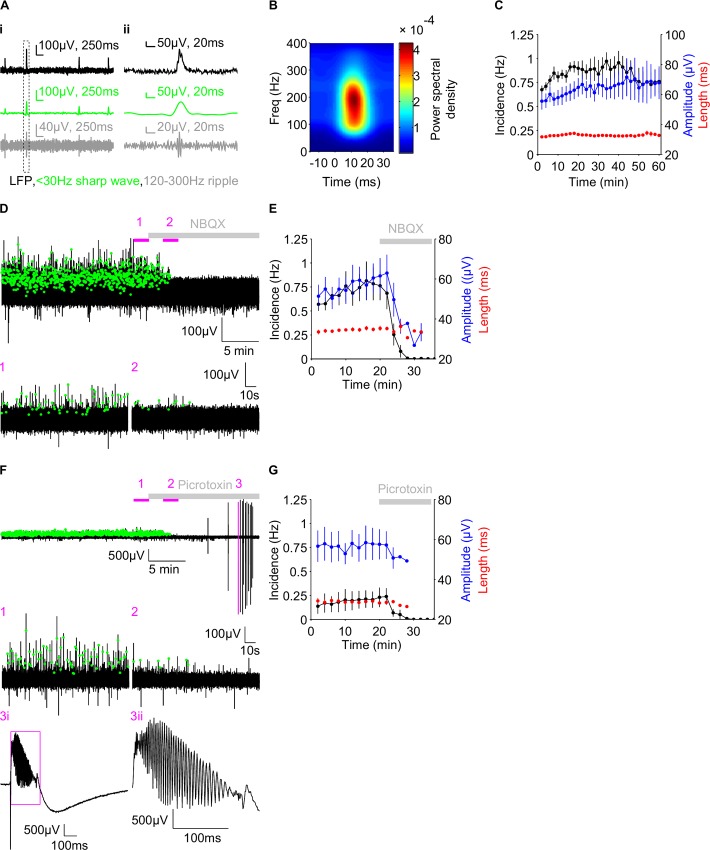
Fig 3. Hippocampal sharp wave characterisation.
A) Example trace of hippocampal sharp waves (i) showing the raw local field potential (upper), the filtered <30Hz sharp wave band (middle) and the filtered 120-300Hz ripple band (lower). A zoomed version of a single sharp wave, demarked by the dotted box in i), is shown in ii). B) Average sharp wave spectrogram showing the power (in colour) of different frequency bands with time. C) Group data of the incidence (black), amplitude (blue) and length (red) of sharp waves, in minute bins, over an hour long recording period. D&F) Example trace (upper) before and after NBQX (D) and picrotoxin (F), of the raw LFP, with detected sharp waves demarked by green dots. Magenta bars indicate the regions shown in the zoomed traces (below). F3ii) Further zoom of the magenta box in F3i. Grey bars in D-G indicate the presence of NBQX (D-E) and picrotoxin (F-G). E &G) Group data of sharp wave properties, in minute bins, before and after NBQX (E) and picrotoxin (G). Data are plotted as mean ± SEM.

