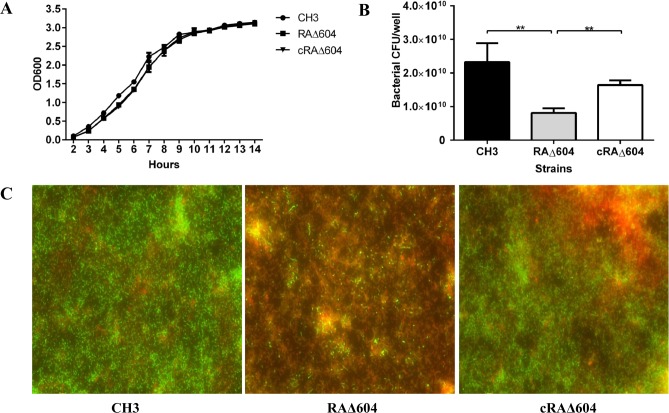
Fig 3. Bacterial growth curves and viability assessment.
(A) There were no significant differences in bacterial growth curves of R. anatipestifer WT strain CH3, RAΔ604, and cRAΔ604 measured as OD600 values at 1-h intervals. The data are presented as the means of three repeats. Error bars represent standard deviations. (B) Bacterial viability was assessed by bacterial CFU counting at 24 h incubation. About 3-fold less CFU counting of the mutant strain RAΔ604, compared to the WT strain CH3. The complementation strain cRAΔ604 recovered the bacterial CFU counting. (C) Live/dead BacLight Bacterial Viability staining reagent was used to view live and dead bacteria. Live cells can be stained as green fluorescent and dead cells can be stained as red fluorescent. Using NIS-Elements Viewer software, we merged the photos of green fluorescent and red fluorescent together (400×).

