Figure 3.
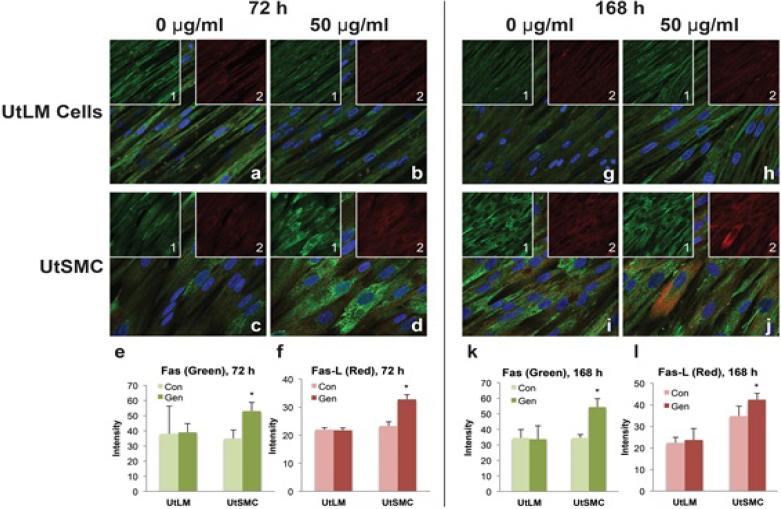
Expression of the receptor, Fas and its ligand, Fas-L in genistein-treated (50 μg/ml) UtLM cells and UtSMC at 72 h (left panel) and 168 h (right panel). Control (0 μg/ml) cells (a, c, g, i) and genistein-treated cells (b, d, h, j). Fas=green fluorescence (inset 1); Fas-L=red fluorescence (inset 2); Fas and Fas-L=merged (a-j). Quantitative measurements of fluorescence intensity of Fas (e and k) and Fas-L (f and l). Nuclei shown as blue fluorescence by DAPI. The results are represented as mean±SEM of three independent experiments *P<0.05 versus control.

