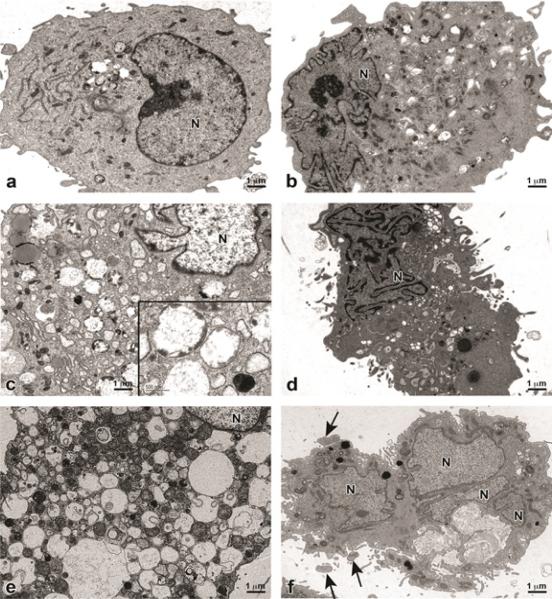
Figure 6.
Transmission electron microscopy images of genistein-treated (50 μg/ml) UtLM cells and UtSMC at 72 h and 168 h. (a) Control UtLM cells (b) Control UtSMC. (c) Genistein-treated UtLM cells at 72 h. Inset: Higher magnification of double and single membraned vacuoles with cytoplasmic debris. (d) Genistein-treated UtSMC at 72 h. (e) Genistein-treated UtLM cells at 168 h. (f) Genistein-treated UtSMC at 168 h. Note: UtSMC have fragmented nucleus (N) and cellular blebbing (arrows). Image, scale bar=1 μm; Inset, scale bar=500 nm.

