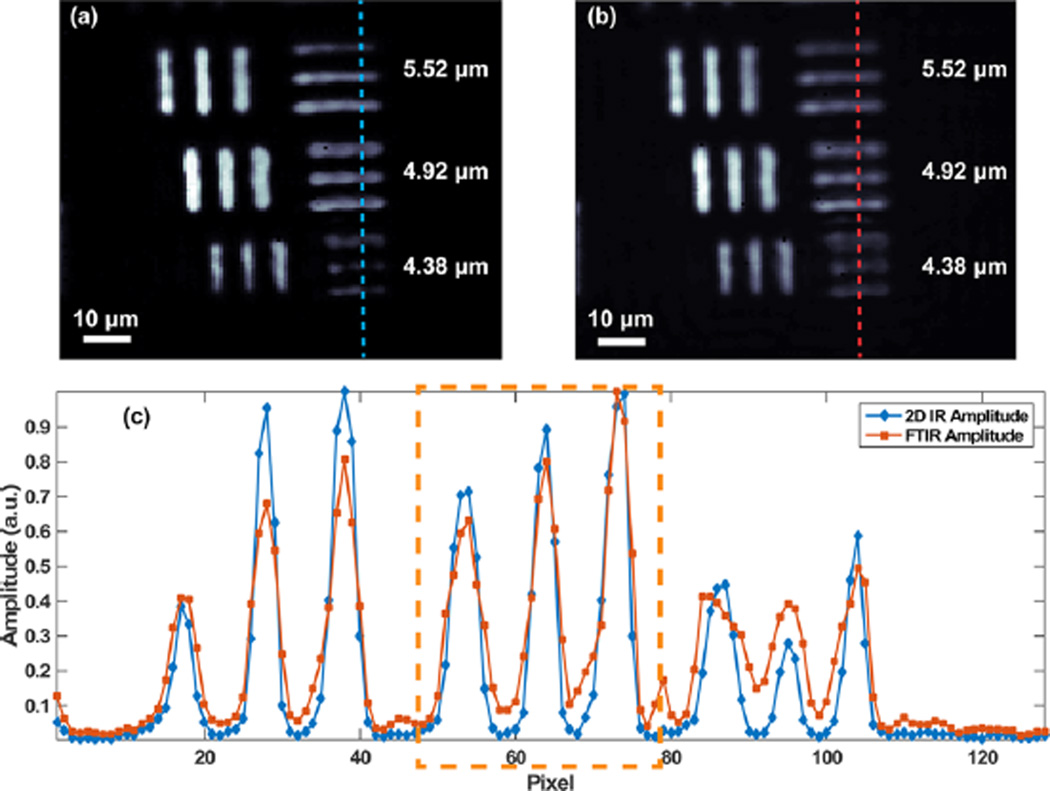
Figure 8.
Comparison of image contrast and resolution between FTIR and 2D-WIRM imaging. (a) 2D IR amplitude image and (b) FTIR amplitude image at the probe frequency of the fundamental peak of a USAF test target with DMDC solution in the sample cell. (c). Slices through the columns indicated by the dotted lines in (a) and (b). Element line widths and spacings are labeled in (a) and (b).

