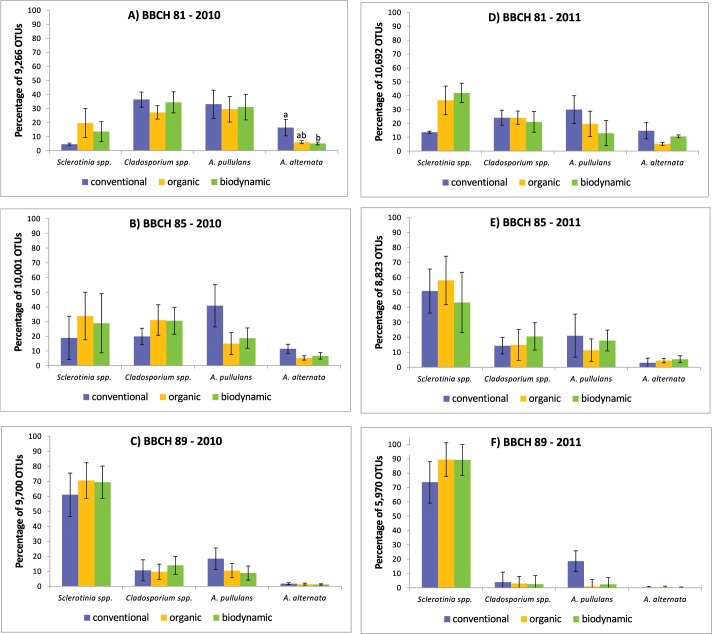
Fig 2. Percentage of identified OTUs belonging to the four most abundant fungal species.
Grapes were sampled in conventional (blue), organic (yellow) and biodynamic (green) vineyard plots in 2010 (A-C) and 2011 (D-F), respectively, at three different stages of maturation (A, D: BBCH 81, beginning of ripening; B, E: BBCH 85, softening of berries; C, F: BBCH 89, berries ripe for harvest). Bars indicate standard errors of four pooled grape samples. Significant differences between abundance of individual fungal species and management systems within the same year and stage of berry ripening are indicated by different letters (Kruskal-Wallis test, P < 0.05).

