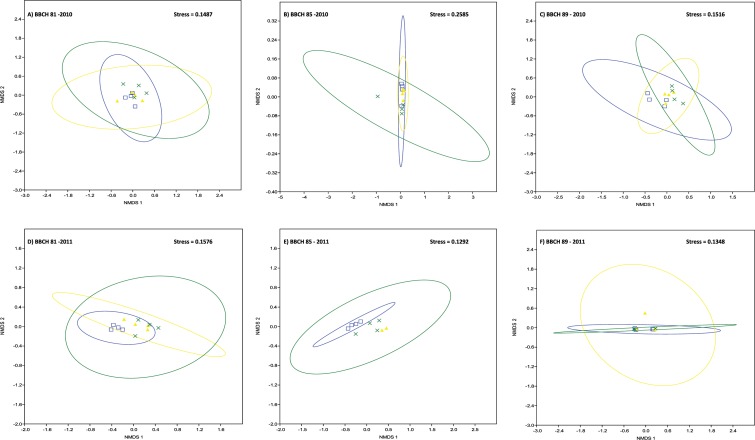
Fig 7. Non-metric multidimensional scaling (NMDS) plot of the bacterial OTU-based clustering data.
The clustering of samples in NMDS ordination indicates that bacterial composition is similar between vineyard management systems (blue squares, blue ellipse = conventional plots; yellow triangles, yellow ellipse = organic plots; green crosses, green ellipse = biodynamic plots). Symbols represent sample values with 95% confidence ellipses drawn around the group centroid. Samples were collected in 2010 (A-C) and 2011 (D-F), respectively, at three different stages of grape maturation (A, D: BBCH 81; B, E: BBCH 85; C, F: BBCH 89).

