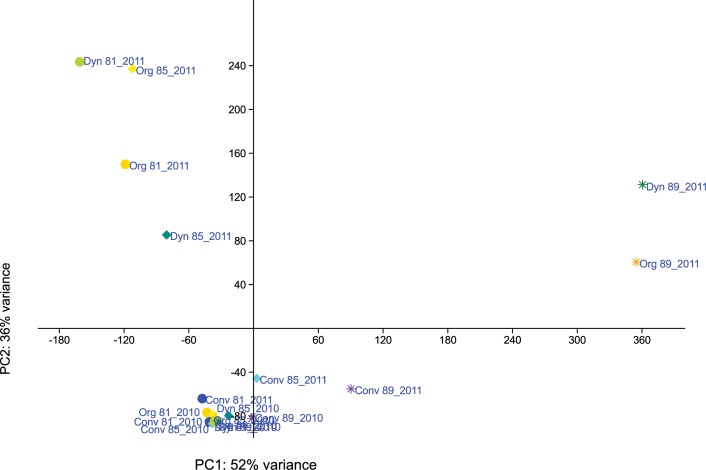
Fig 8. Principal component analysis (PCA) of obtained bacterial OTUs present on the carposphere of grapes.
Samples were collected in 2010 and 2011, respectively, at three different stages of berry maturation. The first two principal components are plotted. Colors indicate samples from different vineyard management systems (blue/purple = conventional plots; yellow/orange = organic plots; green = biodynamic plots); shapes indicate different time points (dot = BBCH 81; diamond = BBCH 85; star = BBCH 89).

