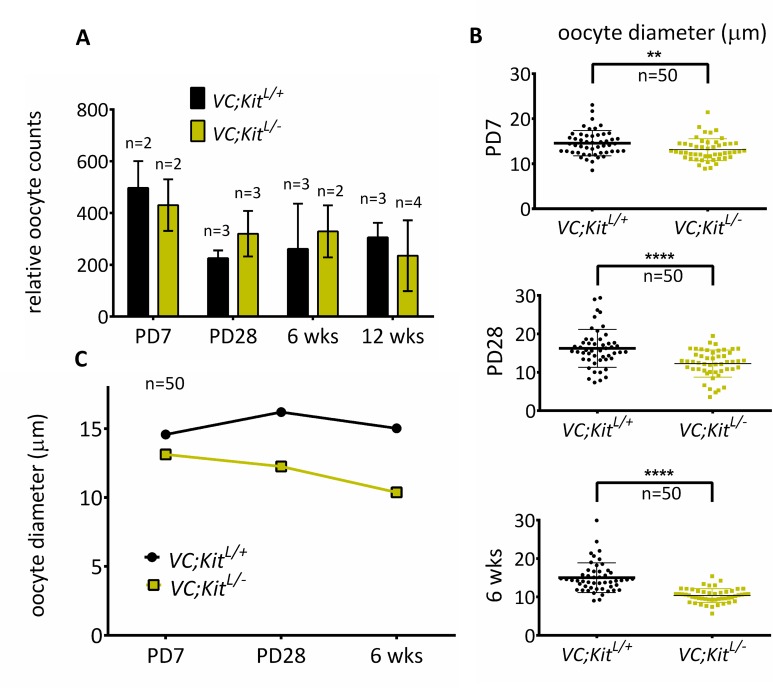
Fig 6. Quantitative analyses of oocyte phenotypes following Kit inactivation in oocytes.
(A) Relative oocyte numbers at PD7 to 12 wks; n = 3 animals per genotype per timepoint except PD7 and 6 weeks experimental (n = 2 animals, total of 4 ovaries analyzed per genotype), error bars = S.E.M. Note that there is no significant oocyte loss up to 12 weeks (p = 0.4475 at 12 weeks, unpaired student t-test). (B) Oocyte diameters (micrometers) of early (primordial/primary) oocytes; **p<0.01, ****p<0.0001; unpaired student t test; n = 50 per genotype. (C) Average oocyte diameters, n = 50 oocytes per genotype per timepoint.

