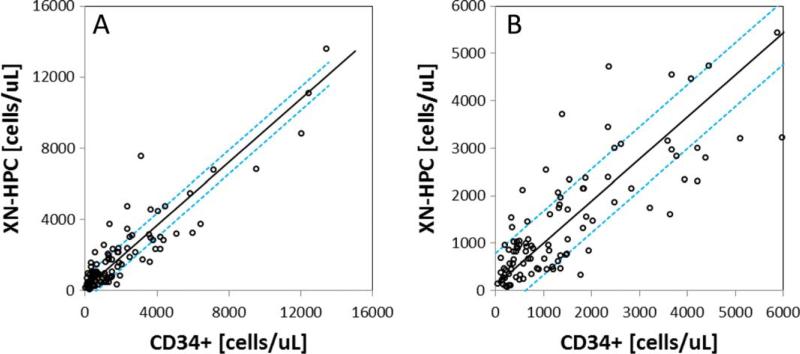
Fig. 2.
Correlation between CD34+ cell counts and XN-HPC analysis of 107 apheresis collections. Passing-Bablok24 linear regression analysis is shown. The dashed line represents ±1 SD from the regression line. (A) Correlation over the entire measured range; (B) correlation observed at low numbers of measured cells (≤6000 × 106 cells/L).

