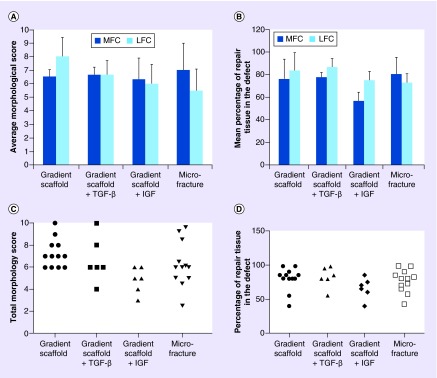
Figure 3. . Gross morphological assessment of retrieved joints 1 year post-implantation.
(A) The average morphological score in MFCs and LFCs, (B) the percentage of the repair tissue filled at the defect site in MFCs and LFCs, (C) the dot plot showing total morphological score distribution in each group and (D) the dot plot showing percentage of repair tissue fill in the defect in each group. Three independent co-authors compiled morphological scores based on parameters in Box 2. Average scores are represented as means ± standard deviations. The maximum possible score a healthy cartilage can receive is 10. Sample sizes are as follows: gradient only scaffold (n = 6), gradient scaffold + TGF-β3 (n = 3), gradient scaffold + IGF-1 (n = 3) and microfracture (n = 6). There were no statistically significant differences among the groups (p > 0.05).
LFC: Lateral femoral condyle; MFC: Medial femoral condyle.

