Fig. 3.

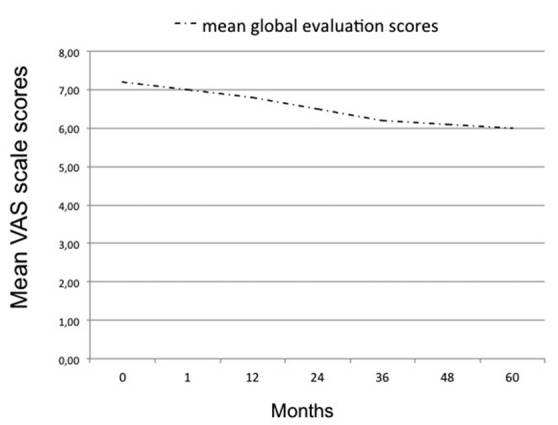
Temporal trend of global patient satisfaction evaluated during longterm follow-up by the VAS score (range 0-10). The indicator represents the mean VAS scores about global satisfaction at each follow-up visit.

Temporal trend of global patient satisfaction evaluated during longterm follow-up by the VAS score (range 0-10). The indicator represents the mean VAS scores about global satisfaction at each follow-up visit.